When shooting and save percentages don’t necessarily add up
Advertisement
Read this article for free:
or
Already have an account? Log in here »
To continue reading, please subscribe:
Digital Subscription
One year of digital access for only $1.44 a week*
- Enjoy unlimited reading on winnipegfreepress.com
- Read the E-Edition, our digital replica newspaper
- Access News Break, our award-winning app
- Play interactive puzzles
*Billed as $5.77 plus GST every four weeks. After 52 weeks, price increases to the regular rate of $19.95 plus GST every four weeks. Offer available to new and qualified returning subscribers only. Cancel any time.
To continue reading, please subscribe:
Add Free Press access to your Brandon Sun subscription for only an additional
$1 for the first 4 weeks*
- Enjoy unlimited reading on winnipegfreepress.com
- Read the E-Edition, our digital replica newspaper
- Access News Break, our award-winning app
- Play interactive puzzles
*Your next Brandon Sun subscription payment will increase by $1.00 and you will be charged $17.95 plus GST for four weeks. After four weeks, your payment will increase to $24.95 plus GST every four weeks.
Read unlimited articles for free today:
or
Already have an account? Log in here »
Hey there, time traveller!
This article was published 11/01/2019 (2700 days ago), so information in it may no longer be current.
In the hockey analytics world, one of the most popular statistics is PDO. It’s a confusing one, because usually those letters would stand for something, making it an acronym, but PDO was just the username of an Edmonton Oilers blogger who created the statistic.
The statistic is a team’s shooting percentage plus a team’s save percentage, and the expectation is that in a league with as much parity as the NHL has, most teams should see their shooting percentage and save percentage add up to 100 per cent, especially at even strength.
Of course, a great goaltender can inflate a team’s PDO, as can an exceptionally talented group of skaters, but one thing we don’t talk about enough is how much shot locations impact expected shooting and save percentages.
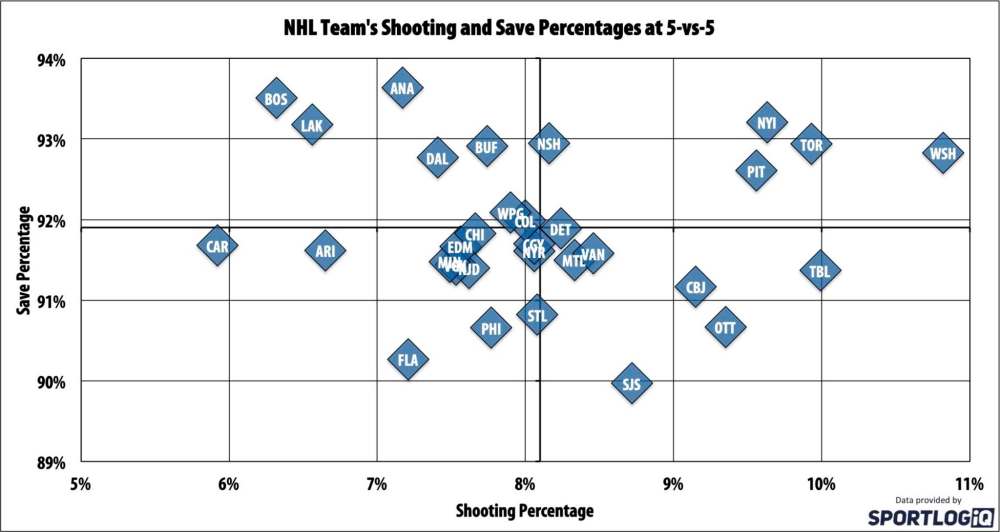
To illustrate this, let’s first look at how all 31 teams have performed at 5-vs-5 in shooting and save percentage.
Looking at accompanying scatter plot, the margins are set at the league averages for both statistics, and we can see that Washington has been the luckiest shooting team. The Capitals, Maple Leafs, Islanders and Penguins have been the luckiest teams overall, far above league average in shooting and save percentages.
Meanwhile, the Hurricanes, Panthers and Coyotes are at the other end of the scale, getting poor conversion rates on their shots and poor performances from their goalies.
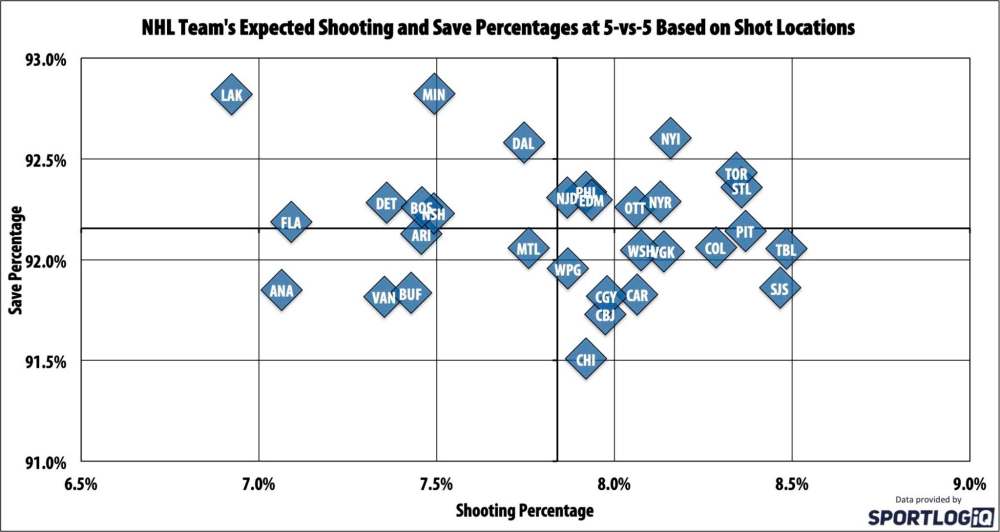
However, how much of the variance from league average is pure luck, and how much is the performance of the teams in question? Using shot locations and expected conversion rates on those shots, we can calculate what each team’s expected shooting and save percentages are. So what does that graph look like?
As you might guess; the variance from the average is far smaller in expected shooting and save percentages than a half season’s worth of actual results. Surprisingly, the two biggest outliers in shooting percentage — Washington and Carolina — have almost the exact same expected shooting percentage at 5-vs-5, both pulling much closer to the league average.
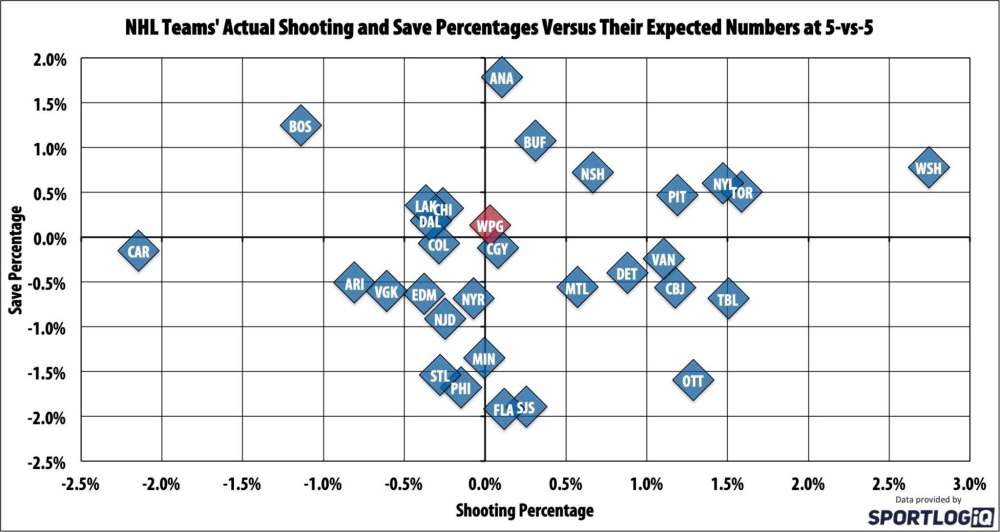
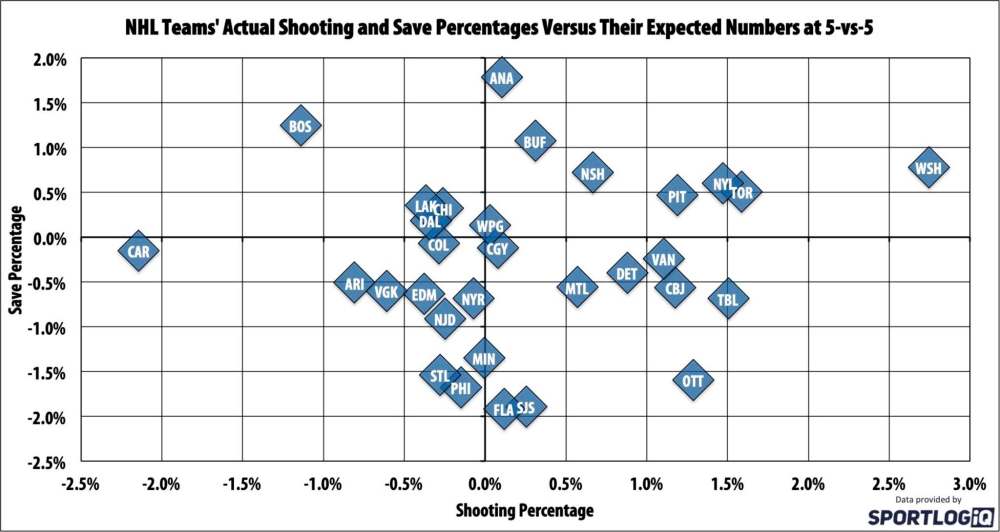
Knowing the expected results of their shots for and shots against, we can create a delta of the actual percentages each team has experienced compared to their expected percentages, and see a more accurate picture of which teams have been fortunate or unfortunate this season.
Looking at teams against their expectations, one thing that’s immediately apparent is that more teams are clustered towards the centre than there were in just raw numbers.
What that means is that the current way things are going after half of a season is closer to the true talent of teams than what we would believe by just looking at teams’ PDO numbers, but the cluster is far less tight than what the raw PDO shows.
Interestingly, some of the teams that looked very lucky look less lucky when you account for their shot locations, especially Tampa Bay. The league-leading Lightning have actually been unlucky in terms of team save percentage at 5-vs-5, and their shooting percentage isn’t as much of an outlier when you account for how excellent they are at generating scoring chances.
This method isn’t a perfect way to calculate how lucky or unlucky a team has been, there are various things that aren’t accounted for, such as team shooting talent, goaltender talent, the impact of passing and pre-shot movement on expected conversion percentages, but it’s a lot closer to representing what we can expect from teams in the second half of the season.
The Capitals, despite their shooting talent, should be expected to score on a far lower percentage of their shots at 5-vs-5 the rest of the year, and the Hurricanes should be expected to score on more.
As for the Winnipeg Jets, they’ve been performing pretty much exactly as you would expect them to based on their shot locations. Since they’re on pace to fight for the top spot in their division, that’s pretty good news.