

A Gathering of Waters
How the Red swells on its journey to Lake Winnipeg
Advertisement
Read this article for free:
or
Already have an account? Log in here »
To continue reading, please subscribe:
Digital Subscription
One year of digital access for only $1.44 a week*
- Enjoy unlimited reading on winnipegfreepress.com
- Read the E-Edition, our digital replica newspaper
- Access News Break, our award-winning app
- Play interactive puzzles
*Billed as $5.77 plus GST every four weeks. After 52 weeks, price increases to the regular rate of $19.95 plus GST every four weeks. Offer available to new and qualified returning subscribers only. Cancel any time.
To continue reading, please subscribe:
Add Free Press access to your Brandon Sun subscription for only an additional
$1 for the first 4 weeks*
- Enjoy unlimited reading on winnipegfreepress.com
- Read the E-Edition, our digital replica newspaper
- Access News Break, our award-winning app
- Play interactive puzzles
*Your next Brandon Sun subscription payment will increase by $1.00 and you will be charged $17.95 plus GST for four weeks. After four weeks, your payment will increase to $24.95 plus GST every four weeks.
Read unlimited articles for free today:
or
Already have an account? Log in here »
Hey there, time traveller!
This article was published 07/04/2009 (6271 days ago), so information in it may no longer be current.
FROM its humble origins as the small Bois de Sioux River along the South Dakota-Minnesota border, the Red River of the North grows wider and deeper until it eventually fans out into a delta at Manitoba’s Netley Marsh and flows into Lake Winnipeg.
As a result, what happens at the south end of the river does not necessarily affect communities downstream, says Alf Warkentin, Manitoba’s chief flood forecaster.
For example, the capacity of the Red River at Selkirk is more than 16 times the river’s capacity at Fargo, N.D. That’s why a massive flood in the United States does not necessarily mean as large a flood in Canada.
The northern stretch of the Red River will only overflow its banks if the same relative conditions present in the U.S. are present in Canada. That means high soil moisture, a lot of moisture sitting on the ground, a fast melt rate, plenty of precipitation and flooding on almost all of the Red’s Manitoba tributaries.
“It takes a lot more than Fargo to give us a flood,” said Warkentin, who sifts through an ocean of data to make flood forecasts.
While there is no such thing as a “normal” spring for a meandering prairie river, patterns have emerged over the decades that aid in flood forecasting.
Here are the most important factors that can determine whether a particular stretch of the Red will overflow its banks:
▼ 1. SOIL MOISTURE
Contrary to popular belief, the ability for the ground to absorb water is the most important factor to consider when predicting a flood. Saturated soil means surface water has nowhere to go.
“What you don’t see is what’s happening below the ground,” Warkentin.
Soil moisture levels have been relatively high in southern Manitoba for much of the past decade.
▼ 2. MOISTURE ABOVE GROUND
Obviously, the amount of snow sitting on the ground each spring is another crucial factor. But more specifically, the moisture content of that snow is important, as crusty, dry snow simply does not create as much meltwater as fresh snow.
While this winter has been a snowy one for southern Manitoba, North Dakota and Minnesota were pummelled much harder. That’s why Fargo has experienced worse relative conditions than Warkentin is expecting north of the border.
▼ 3. MELT RATE
This one’s another no-brainer: If the thermometer suddenly takes off, the amount of surface water increases. Temperatures that hover just above zero – like the ones we’ve had this week – are obviously preferable when it comes to determining how tributaries may swell and contribute more water to the Red River.
▼ 4. PRECIPITATION
This one’s counterintuitive. While spring rains certainly contribute to floods, one April downpour will not necessarily doom Dominion City. Spring precipitation is something that can exacerbate existing flood conditions, as opposed to make or break a flood fight.
▼ 5. TIMING
As the crest of the Red River moves north, flood forecasters watch to see what tributaries are doing. If the Red’s crest meets up with, say, a Roseau, Morris or Rat River crest, localized flood conditions could be worse.
▼ 6. LOCALIZED CONDITIONS
This year, the odd combination of a mid-March thaw and late March freeze-up has created the spectre of ice jams, which can force water to rise rapidly and unpredictably along small sections of the Red River. Flood forecasters cannot predict where and when ice jams will occur, but they can plan to mitigate the effects. Winnipeg is raising the level of all sandbag and clay dikes to 20.5 feet James just in case ice jams occur.
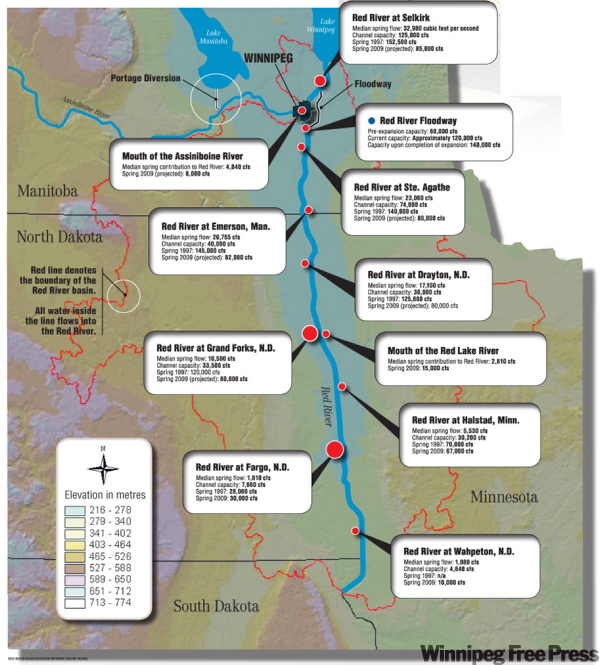
Median spring flow
This is the median amount of water that flows through the Red River at a given point during a “normal spring,” based on data compiled from 1960 to 2007
Channel Capacity
This is how much water the Red River can handle at various points without overflowing its banks. The figures do not take into account flood-protection measures.
Red Lake River and Assiniboine River
Minnesota’s Red Lake River and Manitoba’s Assiniboine are the two most significant tributaries of the Red River. The Assiniboine’s natural flow is reduced by approximately 50 per cent each spring due to two man-made features: The Shellmouth Dam and Reservoir, which holds back water northwest of Russell, and the Portage Diversion, which sends Assiniboine meltwater north into Lake Manitoba.
The Red River Floodway
Built over six years between 1962 and 1968, “Duff’s Ditch” carries floodwater around Winnipeg and returns it to the Red River just north of Lockport. A $665 million expansion undertaken during this decade, which will be completed in several weeks, will increase the capacity to 140,000 cubic feet per second from its original 60,000 cfs. The current capacity is approximately 120,000 cfs.
Red River at Wahpeton, N.D.
Median spring flow: 1,080 cfs
Channel capacity: 4,640 cfs
Spring 1997: n/a
Spring 2009: 10,000 cfs
Red River at Fargo, N.D.
Median spring flow: 1,610 cfs
Channel capacity: 7,660 cfs
Spring 1997: 28,000 cfs
Spring 2009: 30,000 cfs
Red River at Halstad, Minn.
Median spring flow: 5,530 cfs
Channel capacity: 30,200 cfs
Spring 1997: 120,000 cfsSpring 2009: 67,000 cfs
Median spring contribution to Red River: 2,610 cfs
Spring 2009: 15,000 cfs
Red River at Grand Forks, N.D.
Median spring flow: 10,500 cfs
Channel capacity: 33,350 cfs
Spring 1997: 120,000 cfs
Spring 2009 (projected): 80,000 cfs
Red River at Drayton, N.D.
Median spring flow: 17,100 cfs
Channel capacity: 38,000 cfs
Spring 1997: 125,000 cfs
Spring 2009(projected): 80,000 cfs
Red River at Emerson, Man.
Median spring flow: 20,765 cfs
Channel capacity: 40,000 cfs
Spring 1997: 145,000 cfs
Spring 2009 (projected): 82,000 cfs
Red River at Ste. Agathe
Median spring flow: 23,060 cfs
Channel capacity: 74,000 cfs
Spring 1997: 140,000 cfs
Spring 2009 (projected): 80,000 cfs
Red River Floodway
Pre-expansion capacity: 60,000 cfs
Current capacity: Approximately 120,000 cfs
capacity upon completion of expansion: 140,000 cfs
Mouth of the Assiniboine River
Median spring contribution to Red River: 4,840 cfs
Spring 2009 (projected): 8,000 cfs
Red River at Selkirk
Median spring flow: 32,980 cubic feet per second
Channel capacity: 125,000 cfs
Spring 1997: 152,500 cfs
Spring 2009 (projected): 85,000 cfs
How much water is that?
88,200 cubic feet: Capacity of an Olympic swimming pool
3 seconds: Time it took for one Olympic swimming pool worth of Red River water to flow past Fargo last Saturday.
2: Equivalent number of Olympic swimming pools that can flow through the Red River Floodway every second, once the current expansion is complete.
6.7 million: Number of pints of beer that could flow through the floodway each second, once the expansion is complete.
Get used to more of this?
IN southern Manitoba, the Red River has experienced a significant flood three times over the last 13 years: in 1997, 2006 and this spring.
Historically, the river conditions have varied widely. In 1961, the Red River almost ran dry in Winnipeg and produced a terrible stink, Warkentin recalls. Water levels were also low in the early 1990s.
The key factor at work is the extreme variability of the mid-continental climate. The Canadian Prairies and the U.S. Great Plains experience some of the greatest weather extremes on earth, in terms of temperatures and precipitation.
Unfortunately, long-term climate-change predictions call for even more variability for this portion of the continent. Instead of warming, the Red River Valley may simply veer more violently from wet to dry conditions, according to the International Panel on Climate Change.
And that has flood forecasters a little nervous.
“It’s always been extreme, but if it gets more extreme, that could be serious,” Warkentin said.
Manitobans can take solace, however: For now, Mongolia remains even more extreme.
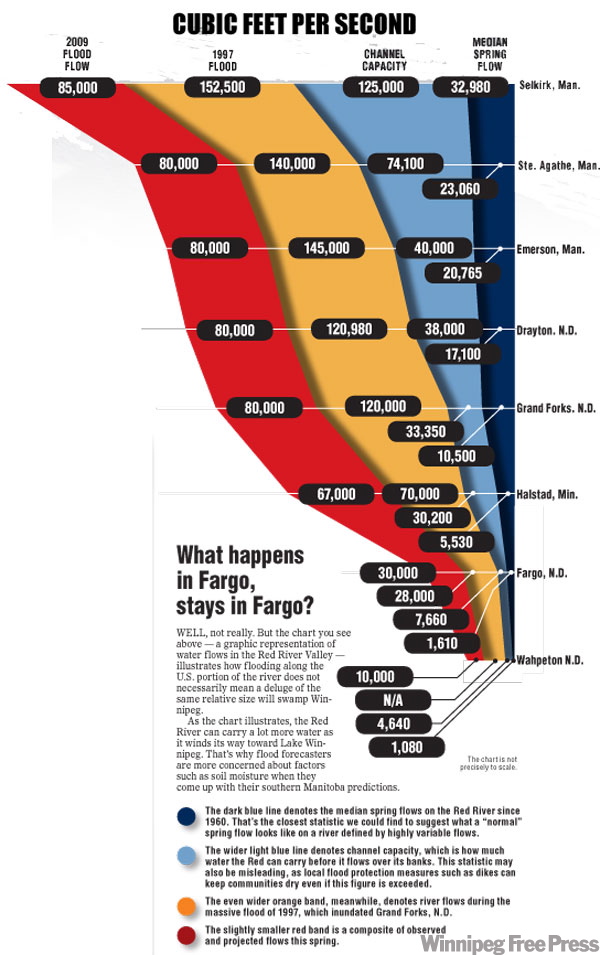
What happens in Fargo, stays in Fargo?
WELL, not really. But the chart you see above — a graphic representation of water flows in the Red River Valley — illustrates how flooding along the U.S. portion of the river does not necessarily mean a deluge of the same relative size will swamp Winnipeg.
As the chart illustrates, the Red River can carry a lot more water as it winds its way toward Lake Winnipeg. That’s why flood forecasters are more concerned about factors such as soil moisture when they come up with their southern Manitoba predictions.
The dark blue line denotes the median spring flows on the Red River since 1960. That’s the closest statistic we could find to suggest what a “normal” spring flow looks like on a river defined by highly variable flows.
The wider light blue line denotes channel capacity, which is how much water the Red can carry before it flows over its banks. This statistic may also be misleading, as local flood protection measures such as dikes can keep communities dry even if this figure is exceeded.
The even wider orange band, meanwhile, denotes river flows during the massive flood of 1997, which inundated Grand Forks, N.D.
The slightly smaller red band is a composite of observed and projected flows this spring.
Sources: Manitoba Water Stewardship, Manitoba Floodway Authority, flood forecaster Alf Warkentin, Winnipeg flood-protection planner Grant Mohr and Free Press files.