

Interactive Graphics
Interactive Graphics
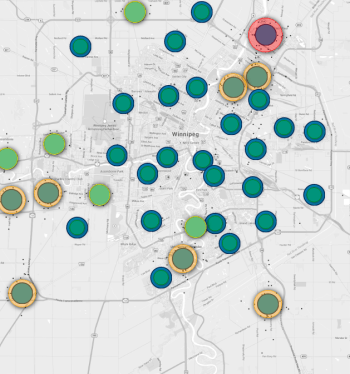
How many mosquitos are buzzing around Winnipeg? Check our interactive map.
2 minute read Thursday, May. 14, 2026Heading outdoors? Need repellent? Find out with our interactive map showing the number mosquitoes caught in traps around the city.
Advertisement
Weather
Winnipeg MB
23°C, Cloudy with wind
Interactive Graphics
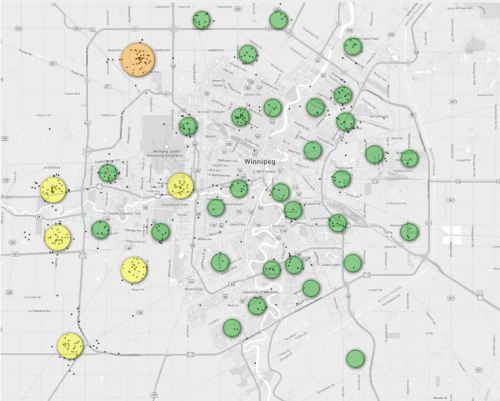
Use our interactive map to keep an eye on mosquito populations near you
2 minute read Preview Thursday, Jun. 21, 2018Interactive Graphics

Interactive map: Who sits where in the Manitoba Legislative Assembly
1 minute read Preview Monday, May. 16, 2016Interactive Graphics
Interactive map: Homicides in Winnipeg, 2016
1 minute read Preview Monday, Jan. 2, 2017
Interactive Graphics
Liberals improve fundraising in Manitoba
2 minute read Thursday, Oct. 15, 2015The federal Liberal Party had its best fundraising year in Manitoba in 2014 in at least a decade, raising significantly more than the federal NDP here despite having only one federal seat in the province.
The Liberals raised $402,672 in Manitoba in 2014 from donors who gave more than $200 that year, compared to the NDP's $282,054 - comparable to their performance in the last few years. The Conservatives remained the fundraising leaders in the province, however, raising $687,591 in 2014
The numbers come from Elections Canada's online database of political donations, where parties are required to report the name and address of anyone giving over $200.
For the Conservatives, Portage-Lisgar, Winnipeg South Centre and Provencher were the top sources of donations - all held by incumbent Conservative MPs. Winnipeg South Centre, however, gave more money to the Liberal Party in 2014 - $116,301 versus $80,483 for the Conservatives.
Interactive Graphics
Comparing GTA ridings with Winnipeg ridings
1 minute read Thursday, Oct. 1, 2015Interactive Graphics
Poll by poll results of the 2011 federal election in Winnipeg
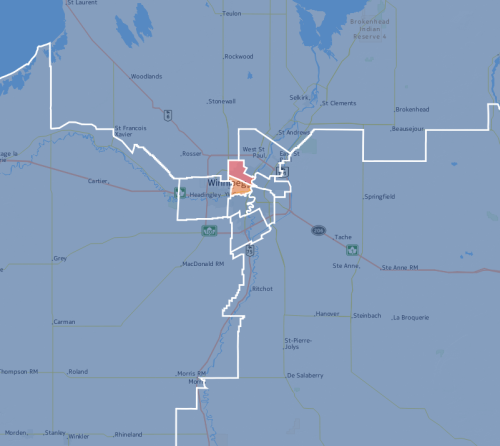
1 minute read Friday, Sep. 18, 2015See how your neighbours voted in our map of 2011 federal election results for Winnipeg by polling division. Click on a polling division to see which riding it was in for the 2011 election and which candidate placed first there.
The black outline reflects riding boundaries for the 2015 federal election.
Federal Election

Winnipeg speaks: We ask you what matters most this election season
1 minute read Preview Monday, Sep. 21, 2015Interactive Graphics
INTERACTIVE MAP: Winnipeg homicides
1 minute read Preview Thursday, Aug. 13, 2015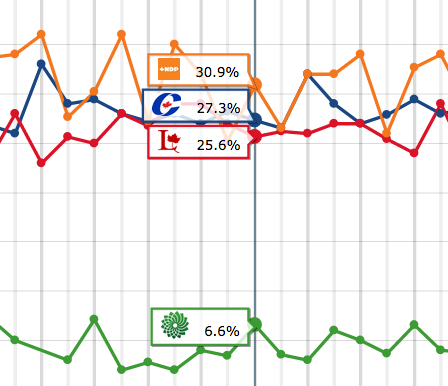
Interactive Graphics
City of Winnipeg 2014 compensation disclosure
1 minute read Thursday, Jul. 2, 2015Winnipeg had 6,509 employees making $50,000 a year or more in 2014. Their names and salaries are made public under law every year. Bartley Kives explores the compensation disclosures in detail here.
Editor's Picks
Tell us where Winnipeg’s problem cycling spots are
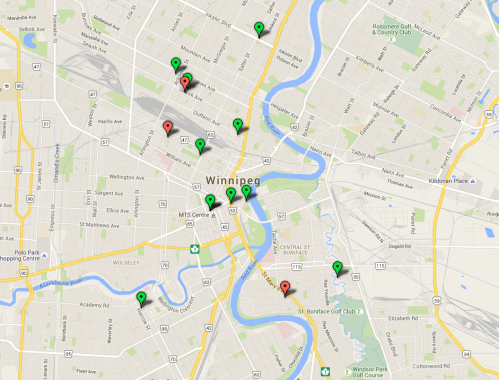
1 minute read Sunday, May. 10, 2015Came across a bike path that goes nowhere? A busy underpass with no space for cyclists? Perhaps a bridge with poor bike path markings? Take a photo and send us a description, so we can add it to our interactive map of cycling problem spots in Winnipeg.
See the map below for some troublesome cycling spots, then send us your own using our form below.
Interactive Graphics
How dangerous is your highway?
1 minute read Friday, Aug. 29, 2014How dangerous is the highway you drive on? Click on a highway to see how many road deaths occured due to rural crashes on it between 2008 and 2014.
Based on information obtained from Manitoba Public Insurance and RCMP. The data deals with the period between Jan. 1, 2008 and July 31, 2014.

LOAD MORE INTERACTIVE GRAPHICS ARTICLES