

Stats, graphs and anecdotes — is grade inflation real?
Advertisement
Read this article for free:
or
Already have an account? Log in here »
To continue reading, please subscribe:
Digital Subscription
One year of digital access for only $1.44 a week*
- Enjoy unlimited reading on winnipegfreepress.com
- Read the E-Edition, our digital replica newspaper
- Access News Break, our award-winning app
- Play interactive puzzles
*Billed as $5.77 plus GST every four weeks. After 52 weeks, price increases to the regular rate of $19.95 plus GST every four weeks. Offer available to new and qualified returning subscribers only. Cancel any time.
To continue reading, please subscribe:
Add Free Press access to your Brandon Sun subscription for only an additional
$1 for the first 4 weeks*
- Enjoy unlimited reading on winnipegfreepress.com
- Read the E-Edition, our digital replica newspaper
- Access News Break, our award-winning app
- Play interactive puzzles
*Your next Brandon Sun subscription payment will increase by $1.00 and you will be charged $17.95 plus GST for four weeks. After four weeks, your payment will increase to $24.95 plus GST every four weeks.
Read unlimited articles for free today:
or
Already have an account? Log in here »
Hey there, time traveller!
This article was published 11/08/2025 (295 days ago), so information in it may no longer be current.
In Not making the grades (July 25), a graph was presented and interpreted as possibly reflecting grade inflation in Manitoba high schools. This was accompanied or followed (letters, op-ed, online) by anecdotes of more university students receiving lower grades, of high school students and their parents pressuring teachers for higher marks, and comments related to issues in public education on the premise of grade inflation.
Is this all much ado?
Based on Manitoba students entering first-year, full-time programs at the University of Manitoba, the graph shows the proportions having a high school average of 95 per cent or more gradually rising from about 15 per cent in Fall 2012 to about 27 per cent in 2019. There was a pandemic-era spike after that, reaching a high of 46 per cent in 2022 and declining to 40 per cent in Fall 2024.
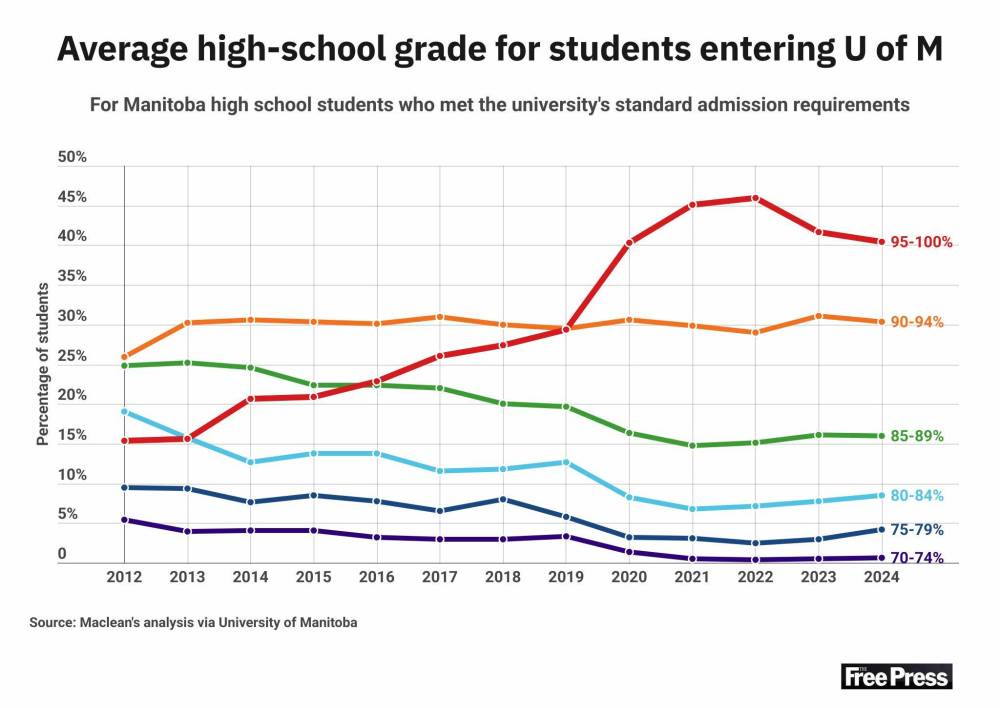
Forty per cent of local high school students who met U of M standard admission requirements in the fall had high-school grades averaging 95 per cent or higher.
The graph uses the common technique of a lopped-off scale — from zero per cent to 50 per cent (rather than zero per cent to 100 per cent). An interpretive caution here is that, intended or not, the technique yields exaggerated depictions of changes and differences. This may leave some more affected than they should be, especially if eager to pounce for expressing beliefs, suppositions and theories about the state of education.
The use of ranges for analysis — 70 per cent-74.9 per cent, 75 per cent-79.9 per cent…90 per cent-94.9 per cent, 95 per cent-100 per cent, in this case — is also common. The caution is that even a very small, broad-based shift in the underlying measure (student marks, in this case) can have a large impact on the trend line, not unlike jumping to a higher tax bracket with one dollar more of income. The aforementioned spike in Fall 2020, therefore, is plausibly due in large part to the lack of provincial Grade 12 tests (mathematics; language arts), as pointed out in the article, rather than to waning high school academic standards.
It should be noted that the graph does not represent Manitoba high school students in general. Based on information from the University of Manitoba’s Office of Institutional Analysis (the Office), each year is based on from 2,750 and 2,950 students, jumping to 3,100 in Fall 2024, in the order of one-third of first year enrollment. This is about a quarter of Manitoba Grade 12 graduating students, and is selectively constrained (student moving directly from high school to university). Inferences about high school grading practices in general may be ill-premised.
The article quotes a university teacher’s experience of doling out more low grades in the context of students being more poorly prepared at high school. Anecdotes are interesting. They may be true or exaggerated for effect, and they risk being generalized.
Before moving to evidence, it should not be casually granted that universities are homes to uniquely and especially reliable measures of student achievement and preparedness, or to steadfastly consistent standards of achievement. Onward.
Reports posted by the Office include tabulated percentages of grades given to students — A+, A…D, F — for each school year by faculty and school (over 160,000 grades annually) and in total. They also include average annual grade point averages (GPA; A+ = 4.5,… D = 1.0).
From 2012/13 to 2018/19, the average undergraduate GPA was between 2.99 and 3.05. Interestingly, in 2019/20, it jumped to 3.24, peaked at 3.29 in 2020/21, and then settled back to about 3.05, somewhat paralleling the trends in the graph of high school averages.
The percentages of undergraduate students achieving an A or A+ showed an overall increasing trend, with a low of 31.3 per cent in 2013/14, highs of 39.5 per cent and 39.0 per cent in 2020/21 and 2021/22, and levelling at 35.3 per cent and 35.7 per cent in the last two years, again somewhat in parallel to other trends.

The proportions of students earning a C or D declined, from a high of 14.4 per cent in 2014/15 to as low as 10.8 per cent in 2021/22, finishing at 12.5 per cent and 12.0 per cent in the latest two years. (There is an increase in the rate of Fs, latterly at 7.4 per cent. The pattern over time is somewhat erratic, ranging from 5.3 per cent to 7.5 per cent.)
On the face, there is no decline in undergraduate student achievement, and perhaps a small improvement.
Reasons other than waning high school academic standards that might explain the trends seen in the graph of high school grades, and other analytical interpretations, are possible and welcome. A research study of systemic grade inflation might be interesting, albeit complex.
Meanwhile, there is cause to question, at least, the existence of high school grade inflation as a basis for understanding, comment and analysis.
Ken Clark, retired in Winnipeg, spent most of his working life in the field of education, and most of that focused on large-scale student assessment. Data analyses and interpretations are his own.
Related Articles
University professors question spike in honour students
Advertisement Advertise With Us
Advertisement Advertise With Us